![]()
Visualization Tool Homepage
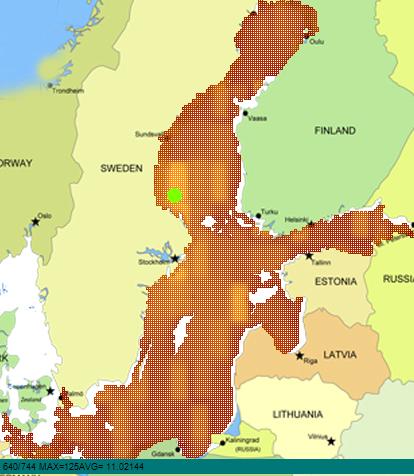
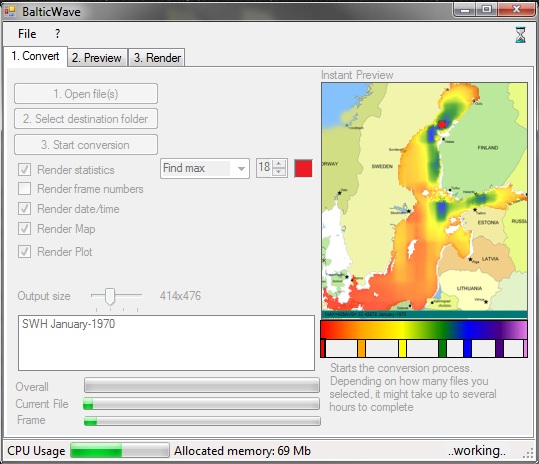
Baltic WAVE is a tool, developed for data-analysis purposes at Tallinn Univeristy of Technology's Department of Cybernetics by Andrea Giudici, within the Project Baltic Way. Its purpose is to open height and direction maps, in ASCII format, and convert them to animated/exportable vector/pseudocolor plots, together with a set of features including statistics and feature tracking. It is compiled using Microsoft Visual Studio C# and it is released under the MIT License terms.
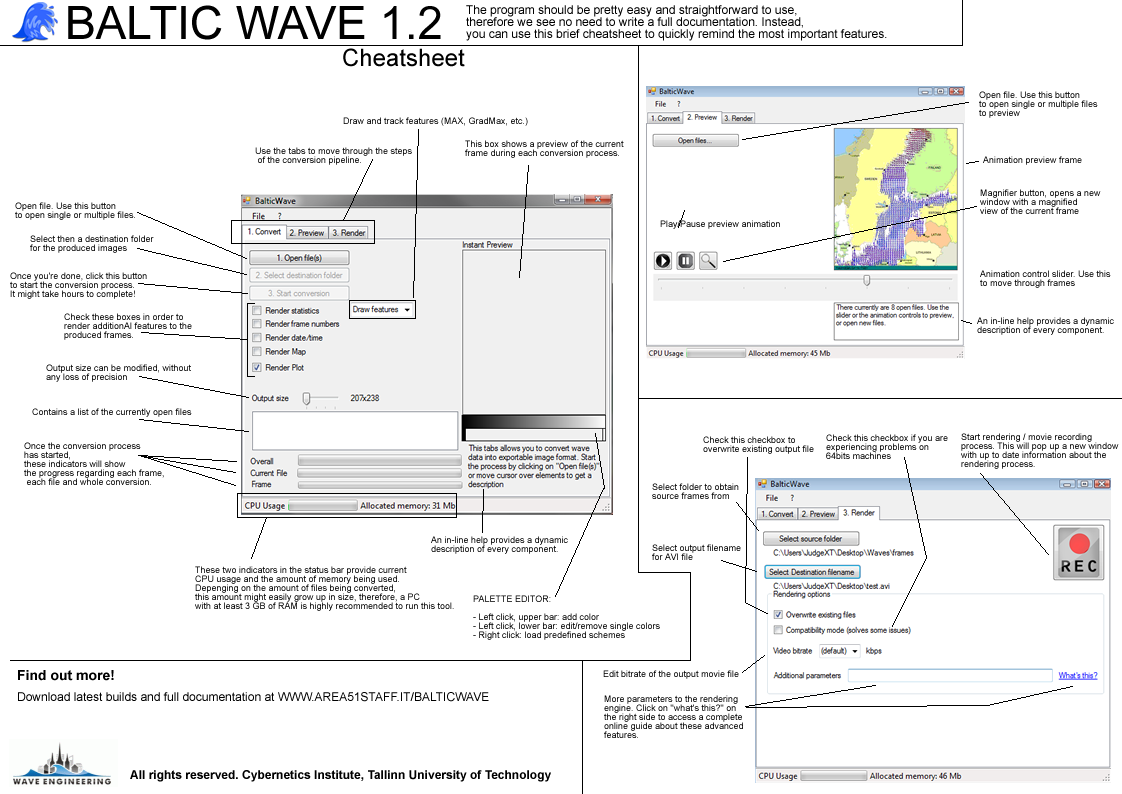
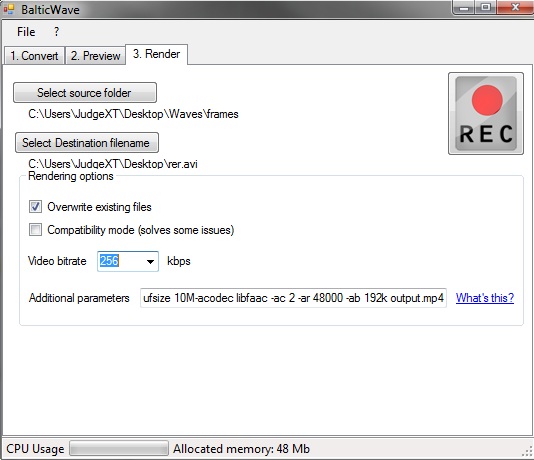
In this page you will find the latest release of the software, together with some screenshots (click on thumbnails to view full size), a manual and a form to request features or bugs corrections to the author.
Download latest version: |
Download Manual/Cheatsheet |
Bug Report / Feature request / Assistance
Even though Baltic WAVE is not officially supported, you can still write the author to report bugs or to request missing features. Though, there is no explicit warranty that problems will be fixed soon. If you happen to be at the Cybernetics Department, you can dramatically speed up coding times by bringing me a coffee, in office B214 :-)